The share of Americans who are likely to take leisure trips overseas in the near term has been trending steadily upward, a development that has been tracked not only in Future Partners’ monthly The State of the American Traveler Study, but also last summer the Conference Board’s Consumer Confidence Index Survey logged the highest ever number of Americans planning to travel overseas in the next six months, and airlines and hotel chains reported surging bookings for international trips at the expense of domestic destinations.
With Americans increasingly traveling abroad, Future Partners takes a closer look at this population of travelers, tapping into the wealth of historical data we have gathered over the years to understand who the American International Traveler* is, what’s drawing them to travel abroad, and how marketers can reach them.
*The American International Traveler is defined here as anyone who has traveled outside of the U.S. in the past 12 months, as of March 2024.
Who are they?
Perhaps this comes as no surprise to those within the travel space, but the American International Traveler has a significantly higher average annual household income at $120,281 compared to $92,711 among the average American traveler, as of March 2024. In greater contrast, non-international travelers have an average annual household income of $80,536. American International Travelers are also significantly more likely to be well-educated; 42.8 percent have completed a graduate degree (vs. 27.0% of total U.S. travelers).
These globetrotting Americans are also more likely to be urban dwellers, with over a third saying they currently live in a large city (34.0%), compared to 26.4 percent of the average American traveler. They are also more likely to say that they have school-aged children whom they travel with at least once a year (35.3% of American International Travelers vs. 27.5% of total U.S. travelers) and to be married (52.5% of American International Travelers vs. 41.6% of total U.S. travelers). Notably, there is not a huge skew in the generational breakouts of American International Travelers. While they are slightly more likely to be Millennials (34.0% vs. 30.0% of total U.S. travelers), more than half of American International Travelers are Gen X or Boomers (54.7% vs. 59.7% of total U.S. travelers).
Travel sentiment
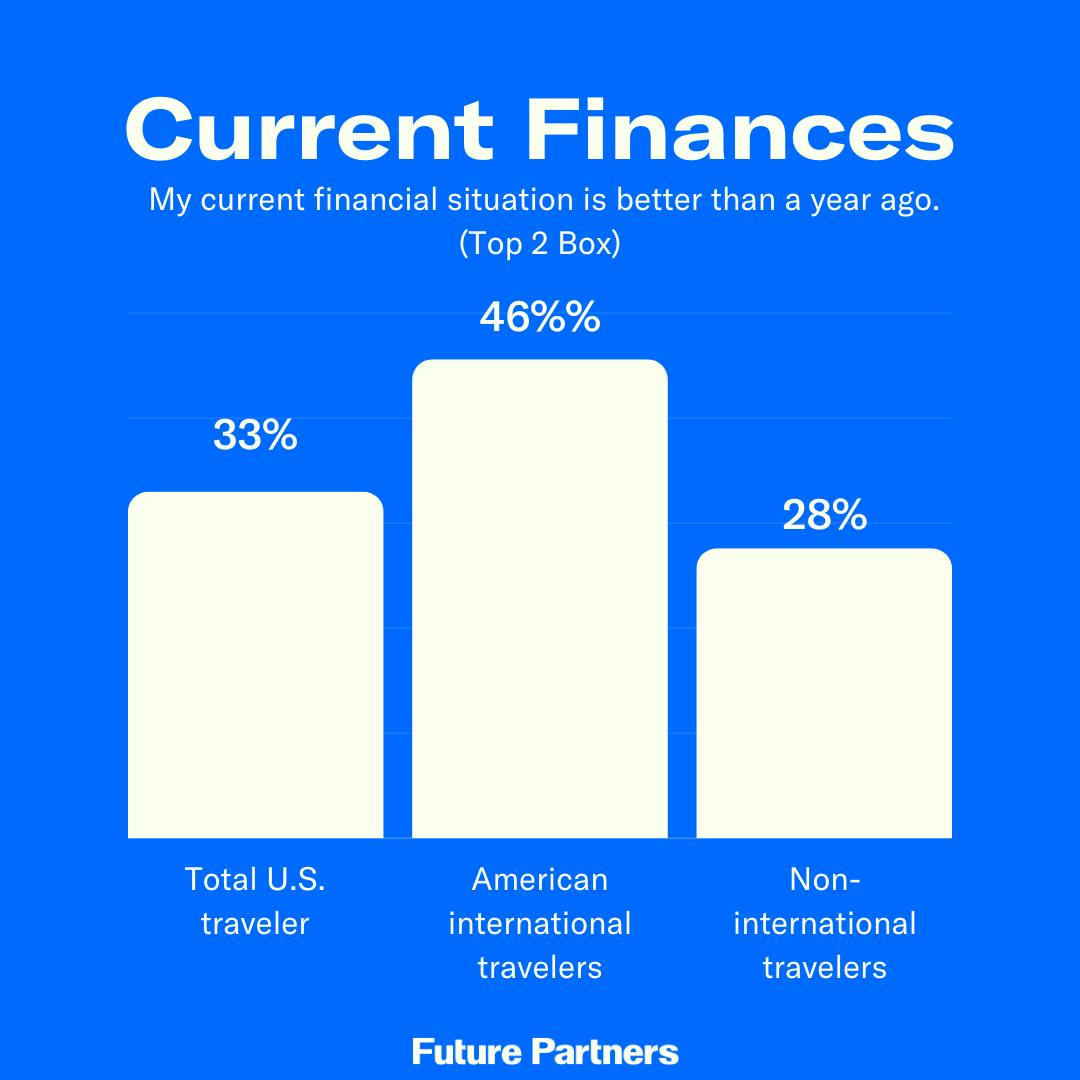
Mirroring their healthy annual income, American International Travelers are much more likely than total U.S. travelers, and even more so than non-international travelers, to say that not only is their current financial situation better than it was a year ago, but they also anticipate that their finances will be even better a year from now.
 This robust financial outlook is reflected in their travel intent, which is similarly sunny. More than half of American International Travelers said they think now is a good time to purchase travel (52.3% vs. 34.2% of total U.S. travelers). Additionally, they are more likely to say that they expect to travel more for leisure in the coming year (32.6% vs. 27.4% of total U.S. travelers), and also to say they anticipate spending more for leisure travel in the same period (35.9% vs. 30.9% of total U.S. travelers).
Looking at which overseas destinations are at the top of their radar for the next year while Canada (26.4%) and Mexico (25.7%) rank highest as destinations American International Travelers are likely to venture to, Italy (22.3%) and the United Kingdom (22.1%) are not far behind. Japan (16.8%) is by far the most popular Asian destination for these travelers, coming behind France (19.9%).
In terms of what drives them to travel, we asked all respondents what motivated their most recent overnight trip. Among American International Travelers, visiting friends and family was less important when compared to the average American traveler (44.3% vs. 50.5%). However, they were much more likely to say that experiencing the culture of the destination (20.7% vs. 14.3% of total U.S. travelers) was a key factor in their decision to visit their last destination, as well as exploring a new place (22.3% vs. 16.4% of total U.S. travelers).
In a similar vein, nearly seven in ten American International Travelers (69.5%) said that they will prioritize visiting places they haven’t been before (vs. 53.3% of total U.S. travelers), visiting cultural institutions (43.7% vs. 28.1% of total U.S. travelers), and/or bucket list travel (49.3% vs. 34.1% of total U.S. travelers).
How to reach American international travelers
Be sure to tap into your digital influencer contact list, because American International Travelers are significantly more likely to say that they have used the opinions of these influencers to plan travel in the past year (28.7% vs. 15.8% of total U.S. travelers). They are also more likely to use online video to plan travel regularly, with nearly half (47.3%) saying they have used this resource in the past year compared to just 32.9 percent of the average American traveler, and three in ten saying they always or usually use online videos to plan their travel (30.2% vs. 17.4% of total U.S. travelers).
 American International Travelers are also more likely to use official destination marketing organization (DMO) resources. One-third said they have used a DMO’s website the plan travel in the past year (32.5% vs. 21.2% of total U.S. travelers), and nearly one-fourth said they have used the online official visitor’s guide (22.5% vs. 15.1% of total U.S. travelers).
Last, if you are exploring different types of content to draw their attention, these travelers are most likely to say they are passionate about food and cuisine (58.2%) and visiting historical sites and attractions (54.2%). But they are also more likely to be passionate about wine (+10.5 percentage points compared to the average U.S. traveler), fitness and wellness (+8.0 percentage points), and art museums (+7.8 percentage points).
Interested in learning more about the American International Traveler, such as what kind of streaming services they use, what podcasts they’re listening to, or their other travel behaviors? Curious about why these Americans want to travel abroad versus exploring the U.S., or how they might travel differently when overseas compared to a domestic trip? Let Future Partners know if you would like to see a deeper dive into The State of the American International Traveler! Email our research team at [email protected].