IMPORTANT: These findings are brought to you from our independent research, which is not sponsored, conducted, or influenced by any advertising or marketing agency. The key findings presented below represent data from over 4,000 American travelers collected in March 2024.
Improvements in Travelers’ Sense of Financial Wellness
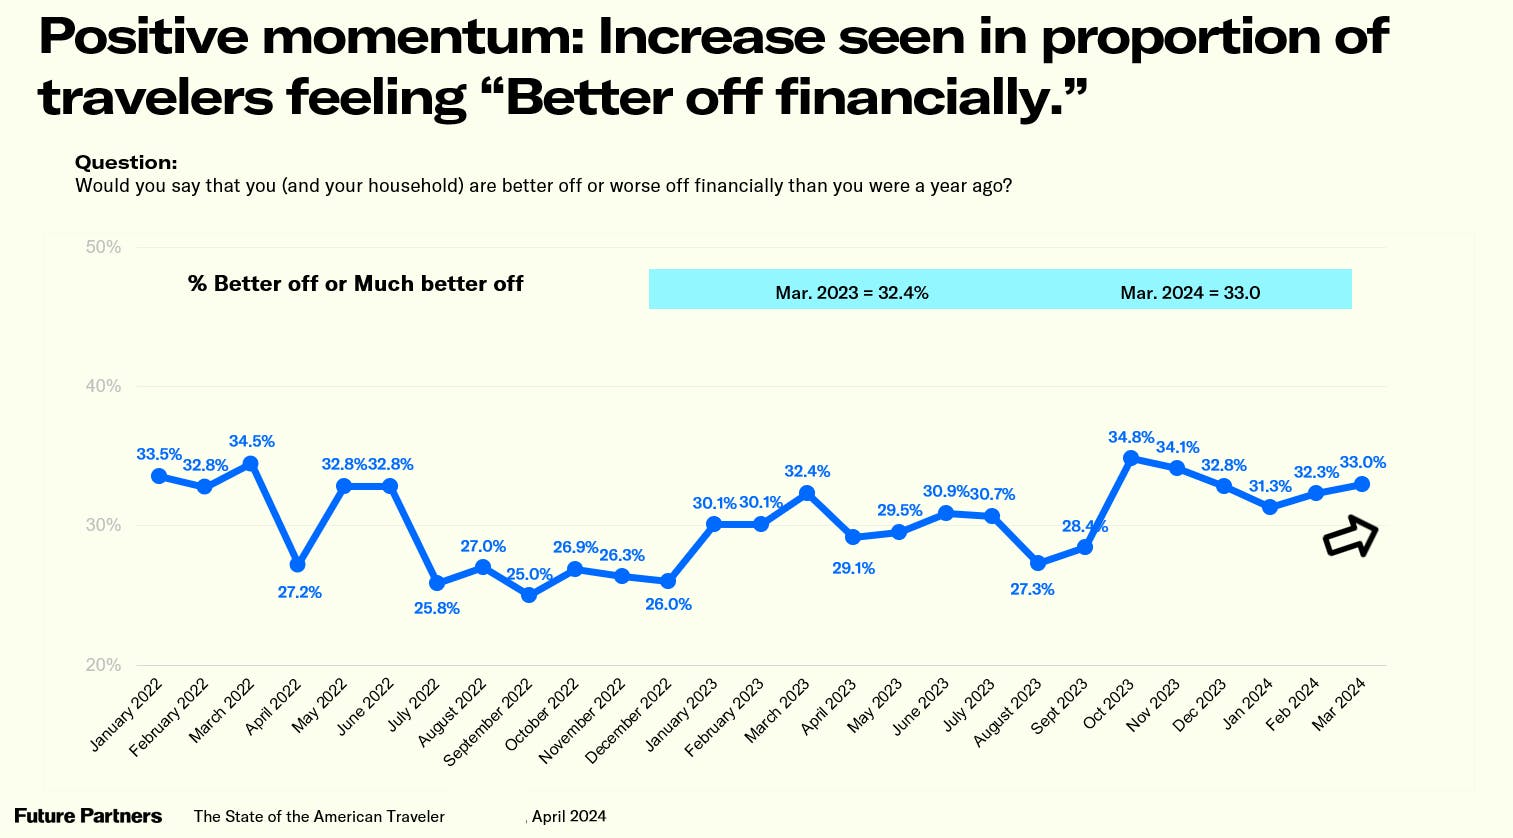
One in three American travelers feel their household finances are better off now than they were one year ago (39% feel this is unchanged, while 28% feel it has worsened). Those in the “better off” camp were most likely to be the younger generational cohorts, with 48% of Gen Zers and 43% of Millennials feeling more financially sound now vs. 29% of Gen X and 26% of Baby Boomer+ saying the same. Looking ahead, younger travelers are much more optimistic that their future finances will continue to improve (71% Gen Z; 61% Millennial vs. 48% Gen X and 32% Baby Boomer+ saying they expect their financial situation will be better a year from now). Despite the uneven optimism, when asked how much of a budget priority travel will be in the near term, about 60% of travelers across all generations say it will be a high priority in the next three months. Looking at the aggregate for this metric, travel being a high near-term budget priority has increased considerably, growing +7pp compared to the start of the year (52% in January, now at 59%). Interestingly though, when asked about their maximum travel spending budget for the next 12 months, Gen Zers reported the highest amount averaging $5,571, followed by Baby Boomer+ with an average budget of $5,551 (vs. Gen X at $4,368 and Millennials at $4,362). With buy now pay later options for financing travel expenditures and a “treat yourself now, can’t afford a house ever” attitude could these factors be contributing to Gen Z travel spending habits?
By region, travel budgets are highest among those who reside in the West and Northeast, each with an anticipated annual budget of over $5,000 ($5,911 and $5,259, respectively compared to $4,888 for all American travelers).
Trends in Travel Planning & the Outlook for Summer
After a lengthy period of shrinking, travel planning windows are on the rise among American travelers. Currently, the average travel planning window for a one-week domestic leisure trip is 11.3 weeks. That is up one whole week compared to last year when the average planning window was just 10.1 weeks. Many are certainly in the midst of trip planning now, as the typical traveler plans to take 3.6 leisure trips in the next 12 months, and 90% plan to take at least one trip in that timeframe—this is the highest this metric has been since February 2022, suggesting a strong outlook. As for the months, Americans plan to take these trips, about a quarter will travel in the spring months of April (24%) and/or May (27%), then in June (32%) and July (32%) trips will hit their seasonal peak, but still a considerable percent plans to travel in late summer/early fall (August 27%; September 23%). Asked what travel experiences they will prioritize in the next 12 months, spending time with loved ones tops the list (72%) followed by visiting new places (53%), enjoying nature (52%), and excitement/energy (44%). And with travel prices continuing to be a top travel deterrent that is keeping Americans from traveling more than they otherwise would prefer, it’s not surprising that nearly twice as many Americans plan to prioritize budget travel (41%) rather than luxury travel (22%). That said, Millennials and Gen Z were much likelier to say they will prioritize luxury travel experiences compared to their older counterparts. When it comes to heading abroad, over one in three American travelers (35%) plan to travel outside the U.S. for leisure in the next 12 months, the highest this metric has been since November of 2023. International travel intentions are highest among Millennials (41%) and Gen Zers (37%) vs. 32% for Gen X and 33% for Baby Boomers. As for the international destinations Americas are most interested in visiting in the next year, Italy, the United Kingdom, Mexico, and Canada top the list.
Spotlight on the Family Traveler
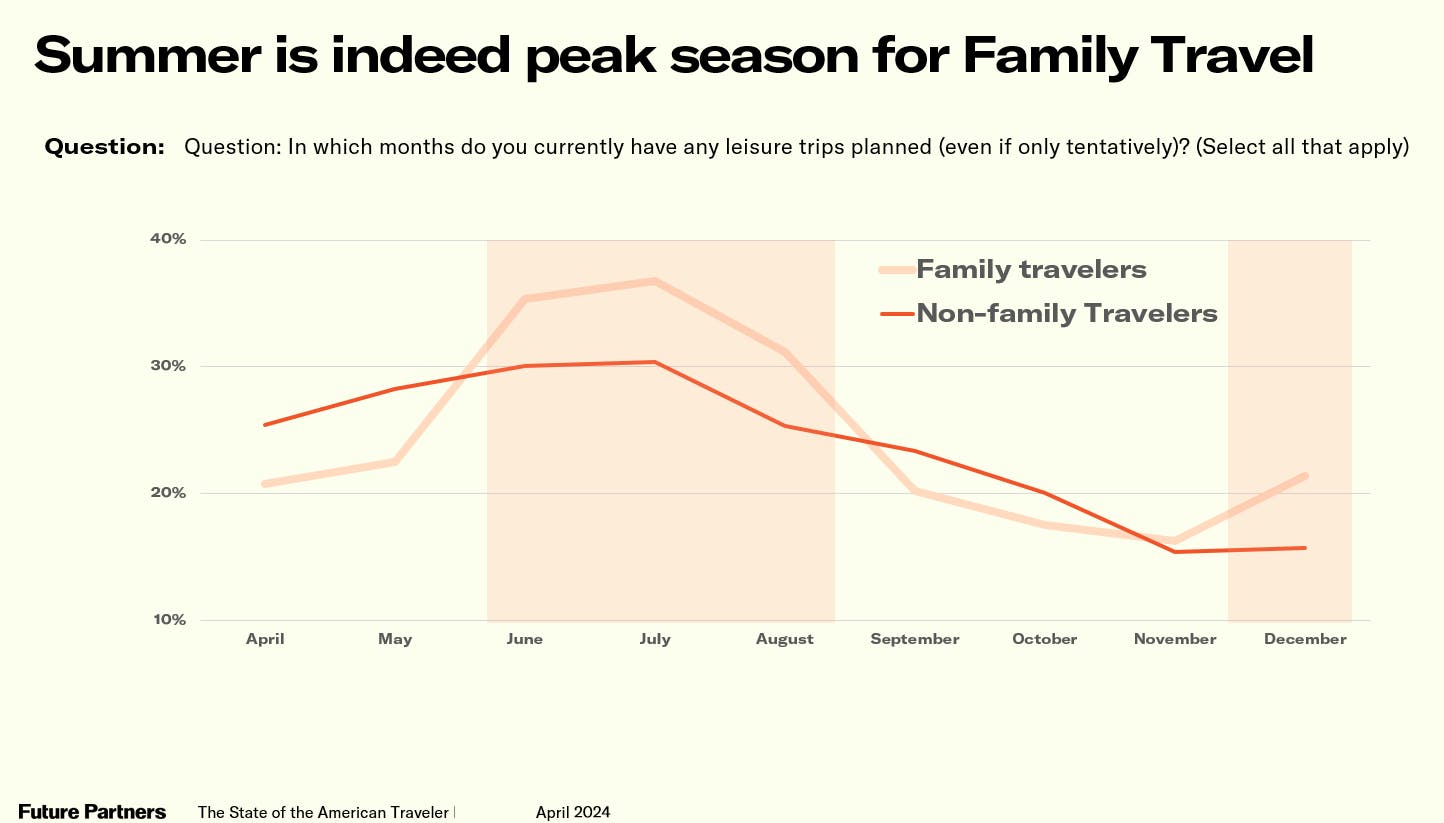
With summer on the horizon and the data confirming that these months are indeed the peak for this traveler segment, here is the latest profile of the Family Traveler.
Family travelers skew Millennial (55.7% vs. 31.3% for Gen X, 7.6% for Gen Z, and 5.4% for Baby Boomers). They have an average annual household income of $107,000 and nearly one in five (18.5%) have or travel with someone who has accessibility needs. The family travel market is showing very strong enthusiasm for traveling this year. American travelers were asked if they expect to travel more, the same, or less for leisure in the next 12 months compared to the last 12-month period and one in three (33.9%) family travelers say they will travel more (vs. 24.9% for non-family travelers). In addition, 43.9% say now is a good time to spend on travel (which is 13pp higher than non-family travelers). Given the high proportion of Millennials that make up this segment, unsurprisingly Family travelers are (in many ways) social media-oriented planners with Facebook, email campaigns, websites found via search engines, and Instagram being the top channels they are receptive to learning about travel destinations. Family travelers are also international-oriented travelers. Far more have traveled outside the U.S. in the past year (39.3% vs. 27.3% for non-family travelers) and looking ahead 45.3% say they are likely to travel abroad in the next 12 months (which is 14pp higher than non-family travelers at 31.3%). When asked what travel experiences they will prioritize in the next year, far more family travelers say they will prioritize enjoying nature (62.6% vs. 47.5% for non-family travelers), excitement/energy (59.2% vs. 38.6%), visiting theme parks (38.2% vs. 12.1%), luxury travel (33.2% vs. 17.1%), and attending sporting events (29.6% vs. 11.6%).
For the complete set of findings, including historic data and custom information on your destination or business, purchase a subscription to The State of the American Traveler study.
Sign up for the next livestream below.
Have a travel-related question idea or topic you would like to suggest we study? Let us know!
We can help you with the insights your tourism strategy needs, from audience analysis to brand health to economic impact. Please check out our full set of market research and consulting services here.